
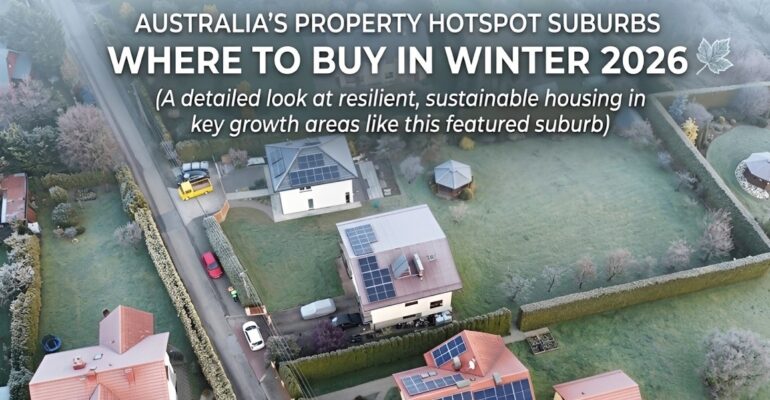
Australia’s Property Hotspot Suburbs: Where to Buy in Winter 2026
Data-driven suburb analysis across all capitals — the locations offering the best value and growth fundamentals right now | June 2026
Why Suburb Selection Has Never Mattered More
In a two-speed property market like Australia’s winter 2026 — where national data masks enormous variation between cities, and city data masks even greater variation between suburbs — location selection has become the single most important variable in property investment success. The wrong suburb in a strong city can underperform. The right suburb in a soft city can still deliver exceptional results.
This guide provides a data-driven suburb analysis across all five major capitals, identifying the locations that offer the strongest combination of capital growth fundamentals, rental demand, and value relative to neighbouring areas. The analysis draws on recent sales data, infrastructure investment pipelines, vacancy rates, demographic trends, and the specific dynamics shaping each market in winter 2026.
Part 1: What Makes a Hotspot in Winter 2026?
In the current environment, a genuine property hotspot needs to satisfy multiple criteria:
Criterion | Why It Matters in 2026 | What to Look For |
|---|---|---|
Rental yield > 4% | Without negative gearing (post-Budget), yield must justify investment | Gross yield 4%–6%+ in tight rental market |
Vacancy rate < 2% | Structural rental demand — tenant competition keeps rents growing | SQM Research / REA vacancy data below 2% |
Infrastructure catalyst | Government spending creates 5–10yr demand uplift | New train line, hospital, university campus nearby |
Relative affordability | Value relative to adjacent suburbs = more buyers = stronger demand | 20%+ below comparable nearby suburb median |
Owner-occupier demand | Mixed demand base protects against investor cycle | Owner-occupier % >50% in suburb profile |
Demographic growth | Population inflow drives sustained demand | New family formation, migration, school catchment |
Supply constraint | Limited new stock in suburb = price support | Established area, minimal greenfield development |
Part 2: Sydney — Buyer’s Market Hotspots
2.1 Sydney Market Overview
Sydney in winter 2026 offers buyers the most accessible conditions in years. Auction clearance rates at or below 60%, ANZ forecasting small price declines, and vendor discounts averaging 3.1%+ across the metro. The opportunity is most concentrated in specific pockets of the outer and middle ring where the combination of infrastructure investment, relative affordability, and rental demand is strongest.
Suburb | Median Price (House) | Median Price (Unit) | Gross Rental Yield | Why It’s a Hotspot |
|---|---|---|---|---|
Parramatta | $1.05M | $630K | 4.2% | Light rail, hospital precinct, CBD 2.0 project; unit market particularly strong |
Liverpool | $890K | $510K | 4.5% | Western Sydney Airport proximity, Aerotropolis employment zone, M12 motorway |
Marsden Park | $870K | $— | 3.9% | North West growth corridor, NWRL catchment, young family demographic |
Sutherland | $1.35M | $720K | 3.8% | Lifestyle, beach access, train; relative value vs Northern Beaches premium |
Ryde / Meadowbank | $1.15M | $650K | 4.1% | Macquarie Park innovation precinct, new rail connections, employment anchor |
2.2 Sydney Infrastructure Catalyst Map
Sydney’s infrastructure pipeline remains one of the most significant in the nation, with billions of dollars of committed spending shaping 5–10 year demand patterns for adjacent suburbs. Key active projects in 2026 with the most direct property market impact:
- Western Sydney Airport (Badgerys Creek) — operational from 2026, Aerotropolis employment zone expected to add 200,000+ jobs over 20 years. Surrounding suburbs: Liverpool, Penrith, Campbelltown.
- Sydney Metro West — Stage 2 under construction; connecting Westmead to the CBD via Olympic Park, Five Dock, Burwood. Stations at Five Dock, Sydney Olympic Park particularly impactful.
- Parramatta Light Rail — operational Stage 1, Stage 2 approved. Connecting Westmead to Carlingford; direct property demand uplift in station catchment areas.
- NorthConnex and M12 motorway — reducing commute times for outer western and south-western Sydney suburbs, supporting lifestyle affordability play.
Part 3: Melbourne — Value in a Soft Market
3.1 Melbourne Market Overview
Melbourne’s property market in winter 2026 presents some of the most compelling value in its history for patient buyers. ANZ forecasts price declines of up to -1.7% for 2026 as a whole. The investor retreat driven by land taxes has created genuine buying opportunities. Properties with defects or requiring work are sitting at significant discounts — but properties with good bones in strong school catchments are still selling reliably.
Suburb | Median Price (House) | Median Price (Unit) | Gross Rental Yield | Why It’s a Hotspot |
|---|---|---|---|---|
Footscray | $850K | $480K | 4.6% | Hospital precinct, Metro Tunnel station (2025 open), gentrification tailwind |
Preston | $1.05M | $540K | 4.0% | Darebin growth corridor, light rail, relative value vs Northcote premium |
Ringwood | $980K | $570K | 3.9% | Eastlink hub, retail precinct, Eastland expansion; eastern corridor gateway |
Reservoir | $890K | $470K | 4.3% | North corridor infrastructure, new school investment, strong rental demand |
Sunshine | $810K | $460K | 4.7% | Sunshine SUPER-HUB infrastructure precinct; Airport Rail Link catalyst |
3.2 Melbourne’s Airport Rail Link — The Decade’s Biggest Catalyst
The Melbourne Airport Rail Link — connecting the CBD to Melbourne Airport via Sunshine — is the most significant infrastructure catalyst for Melbourne’s property market in the 2026–2030 window. Sunshine, already well-located for western suburbs employment, is positioned to become a genuine transport super-hub. Property values in Sunshine and surrounding suburbs (St Albans, Albion, Deer Park) carry infrastructure uplift potential that is not yet fully priced in.
Part 4: Brisbane — Riding the Olympic Wave
4.1 Brisbane Market Overview
Brisbane remains one of Australia’s strongest property markets, supported by population growth, relative affordability versus Sydney and Melbourne, and the extraordinary infrastructure pipeline associated with the 2032 Brisbane Olympic and Paralympic Games. Properties are selling more quickly than in Sydney and Melbourne, and buyers need to move with decisive pre-approval in hand.
Suburb | Median Price (House) | Median Price (Unit) | Gross Rental Yield | Why It’s a Hotspot |
|---|---|---|---|---|
Logan Central | $620K | $340K | 5.8% | Highest gross yield in SEQ, Logan Hospital precinct, infrastructure investment |
Yeronga | $1.15M | $680K | 3.9% | Toowong adjacent, Oxford St village, train access, Brisbane River proximity |
Carseldine | $920K | $— | 4.0% | Norths corridor, relative value vs Aspley/Nundah, proximity to Sunshine Coast hwy |
Woolloongabba | $1.25M | $690K | 4.2% | Direct Olympic infrastructure zone — new train station, stadium precinct |
Wynnum-Manly | $980K | $590K | 4.1% | Bay lifestyle, relative value vs bayside premium, improved road access |
4.2 The Olympic Infrastructure Pipeline
The 2032 Brisbane Olympics represents an unprecedented infrastructure catalyst for South East Queensland property. The Woolloongabba Olympic Precinct — site of the new stadium and already home to a new Cross River Rail station — is experiencing significant commercial and residential investment. Athletes’ Village sites at Hamilton and Northshore are creating urban renewal precincts with 10-year development pipelines that will fundamentally transform the surrounding suburbs.
Part 5: Perth — Still Strong, Increasingly Selective
5.1 Perth Market Overview
Perth remains the nation’s strongest property market in winter 2026, with 12.3% price growth forecast for 2026 as a whole. However, the easy money in Perth has been made — the median house price has risen almost 90% over 5 years in some pockets. The opportunity now requires selectivity, with the best prospects in suburbs that retain relative affordability while carrying genuine fundamental support.
Suburb | Median Price (House) | Gross Rental Yield | 5-Year Growth | Why It’s a Hotspot |
|---|---|---|---|---|
Balga | $490K | 6.2% | +82% | Most affordable metro suburb with tight vacancy; infrastructure upgrade underway |
Armadale | $520K | 5.9% | +88% | Forrestfield–Airport Link uplift, relative value vs established SE suburbs |
Midland | $560K | 5.7% | +79% | Major hospital and health precinct, Swan Valley gateway, rail access |
Rockingham | $650K | 5.1% | +75% | Naval base employment, beach access, southern corridor growth |
Ellenbrook | $680K | 4.8% | +71% | Family demographic, new schools, retail infrastructure, north-east corridor |
Part 6: Adelaide — Consistent Value Across the Board
Suburb | Median Price (House) | Gross Rental Yield | Key Driver |
|---|---|---|---|
Elizabeth | $420K | 6.5% | Highest yield in Adelaide metro; defence industry employment (RAAF) |
Salisbury | $530K | 5.8% | Northern corridor growth, defence sector employment, relative affordability |
Prospect | $920K | 3.9% | Inner north gentrification, walkability, café culture — lifestyle upgrade appeal |
Hackham | $540K | 5.4% | Southern corridor, Noarlunga employment precinct, coastal proximity |
Glenelg | $1.05M | 4.0% | Beach lifestyle, consistent demand, tourism economy support for short-stay returns |
Part 7: Cross-Market Comparison — Best Opportunities by Buyer Type
Buyer Type | Best City | Best Suburb Type | Key Metric | Rationale |
|---|---|---|---|---|
First home buyer | Adelaide | Northern / southern corridor | Yield + affordability | Most accessible major capital, infrastructure growth |
Upgrader | Sydney / Melbourne | Established middle ring | Relative value + school catchment | Best buyer’s market in decade |
Cash flow investor | Perth | Northern corridors (Balga, Midland) | Gross yield 5.5%+ | Structural rental undersupply + growth momentum |
Growth investor | Brisbane | Olympic infrastructure precincts | 5yr capital growth potential | Olympic catalyst + population growth |
Yield + growth balance | Brisbane / Adelaide | Employment-anchored suburbs | 4.5%–6% yield + 7%+ annual growth | Best risk-adjusted total return markets |
Conclusion: The Research-First Imperative
In winter 2026, the difference between a well-chosen suburb and a poorly chosen one is likely measured in hundreds of thousands of dollars over a 5–10 year horizon. The broad market conditions — rates, credit, sentiment — matter, but suburb-level fundamentals matter more for individual outcomes. The hotspots identified in this guide share a common thread: structural demand drivers (infrastructure, employment, population) combined with current relative value and tight rental markets.
Use this analysis as a starting framework, not a final answer. Supplement it with current sold data from CoreLogic or Domain, local rental vacancy data from SQM Research, and advice from a buyers’ agent with genuine local expertise in your target market.
Disclaimer: Suburb data and median prices are indicative estimates based on publicly available market data as at June 2026. Property values can fall as well as rise. This article does not constitute investment advice. Always conduct your own due diligence and seek independent professional advice before purchasing property.